
Twitter (Manchester United) - Sentiment Analysis - Python

Social Media and Network Analytics Manchester United Twitter Account
Nowadays, soccer is one of the most trending topics in newspapers, social media, Sports TV and radio, and even more if it is related to the English tournament, which is the most powerful one.
This project will focus its attention in Manchester United FC Twitter account, as it is the biggest club in England. The Accountancy firm Deloitte estimates that Manchester United has 75 million fans worldwide, while other estimates put this figure closer to 333 million . The club also has 71
million fans in social media, which makes it the third football club with most social media followers in the world after Real Madrid and Barcelona.
This project will consist in extract Data from Twitter, clean it, visualize it and finally get some insights.
Thankfully Twitter provides their own API that allows users to collect information from a particular account Time Line or topic, among others.
The data collection technique used for this analysis was REST, which allows the users to query a twitter account only by registering in the API site. Note that when registering, the API will generate a set of Keys(passwords) that would allow you to pull the data required.
The data collected was stored in a .json file , that allows the user to query any single feature in the Twitter corpus in order to analyse the downloaded dataset.
- Note: For this excersice we are only extracting the last 1000 tweets.
After pulling the data from the twitter API, I import the needed packages.
import tweepy           # To consume Twitter's API
import pandas as pd
from IPython.display import display
import numpy as np
import matplotlib.pyplot as plt
import seaborn as sns
import sys
from collections import Counter
import json
import tweepy
tweets = []
The first step executed was to open tha .json file where the information was stored:
if __name__ == '__main__':
    fname = 'ManUtd'
    with open(fname, 'r') as f:
        for line in f:
            tweet = json.loads(line)
            tweets.append(tweet)
print("Number of tweets extracted: {}.\n".format(len(tweets)))
Number of tweets extracted: 1000.
The second step executed was to get some basic statistics and printed information of the information collected as follow:
- The first 5 Tweets:
# We print the most recent 5 tweets:
for tweet in tweets[:5]:
    print(tweet['text'])
    print()
"Watching him I thought, he's definitely got something." 👀

We caught up with former #MUFC scout Jim Ryan in our latest UTD Podcast 🎧

📖 Our #MUNWHU issue of #UnitedReview is now available to purchase.

Click below to order your copy and any other ed… https://t.co/dt6qsDUrpV

We’re glad you’re okay, @EricBailly24 ❤️

#MUFC https://t.co/O9gxpRwFZL

The latest fitness update for our penultimate #PL match of the season on Wednesday 👇

#MUFC #MUNWHU

⚽️ A classic #GoalOfTheDay, brought to you by Yorkie and @VanCole9.

#MUFC https://t.co/rZxKicpSq0
In order to organize the data, I create a dataframe using Pandas and display again the first Ten tweets:
#Creating a (pandas) DataFrame

# create a pandas dataframe as follows:
data = pd.DataFrame(data=[tweet['text'] for tweet in tweets], columns=['Tweets'])

# display the first 10 elements of the dataframe:
display(data.head(10))
| Tweets | |
|---|---|
| 0 | "Watching him I thought, he's definitely got s... |
| 1 | 📖 Our #MUNWHU issue of #UnitedReview is now av... |
| 2 | We’re glad you’re okay, @EricBailly24 ❤️\n\n#M... |
| 3 | The latest fitness update for our penultimate ... |
| 4 | ⚽️ A classic #GoalOfTheDay, brought to you by ... |
| 5 | All eyes on the run-in 👊\n\n#MUFC #PL |
| 6 | RT @MarcusRashford: There’s no where to hide t... |
| 7 | It's time to dust ourselves off and prepare fo... |
| 8 | "We are really sad about the result and losing... |
| 9 | 💬 "We're very disappointed but we need to be b... |
Twitter API provides multiple fields per twitter, then I print the mosre relavants for the analysis.
# print info from the first tweet:
print(tweets[0]['id'])
print(tweets[0]['created_at'])
print(tweets[0]['source'])
print(tweets[0]['favorite_count'])
print(tweets[0]['retweet_count'])
print(tweets[0]['geo'])
print(tweets[0]['coordinates'])
print(tweets[0]['entities'])
1285290880925085696
Mon Jul 20 19:10:00 +0000 2020
<a href="https://ads-api.twitter.com" rel="nofollow">Twitter for Advertisers</a>
2812
199
None
None
{'hashtags': [{'text': 'MUFC', 'indices': [85, 90]}], 'symbols': [], 'user_mentions': [], 'urls': []}
After checking which information was pulled from the relevant fields, I continue to include the relevant fields to the previously created dataframe and print again the first Ten tweets:
# Adding relevant info to our dataframe

# We add relevant data:
data['len']  = np.array([len(tweet['text']) for tweet in tweets])
data['ID']   = np.array([tweet['id'] for tweet in tweets])
data['Date'] = np.array([tweet['created_at'] for tweet in tweets])
data['Source'] = np.array([tweet['source'] for tweet in tweets])
data['Likes']  = np.array([tweet['favorite_count'] for tweet in tweets])
data['RTs']    = np.array([tweet['retweet_count'] for tweet in tweets])

data['Date']=pd.to_datetime(data.Date)
# Display of first 10 elements from dataframe:
display(data.head(10))
#print(data.dtypes)
| Tweets | len | ID | Date | Source | Likes | RTs | |
|---|---|---|---|---|---|---|---|
| 0 | "Watching him I thought, he's definitely got s... | 133 | 1285290880925085696 | 2020-07-20 19:10:00+00:00 | <a href="https://ads-api.twitter.com" rel="nof... | 2812 | 199 |
| 1 | 📖 Our #MUNWHU issue of #UnitedReview is now av... | 140 | 1285270496653848582 | 2020-07-20 17:49:00+00:00 | <a href="https://ads-api.twitter.com" rel="nof... | 1858 | 112 |
| 2 | We’re glad you’re okay, @EricBailly24 ❤️\n\n#M... | 71 | 1285255401542496259 | 2020-07-20 16:49:01+00:00 | <a href="http://twitter.com/download/iphone" r... | 18045 | 1108 |
| 3 | The latest fitness update for our penultimate ... | 99 | 1285244172941885440 | 2020-07-20 16:04:24+00:00 | <a href="https://ads-api.twitter.com" rel="nof... | 3437 | 241 |
| 4 | ⚽️ A classic #GoalOfTheDay, brought to you by ... | 99 | 1285200032476454914 | 2020-07-20 13:09:00+00:00 | <a href="https://studio.twitter.com" rel="nofo... | 4262 | 409 |
| 5 | All eyes on the run-in 👊\n\n#MUFC #PL | 35 | 1285176628335673344 | 2020-07-20 11:36:00+00:00 | <a href="https://ads-api.twitter.com" rel="nof... | 9992 | 672 |
| 6 | RT @MarcusRashford: There’s no where to hide t... | 140 | 1285166311308500993 | 2020-07-20 10:55:00+00:00 | <a href="https://mobile.twitter.com" rel="nofo... | 0 | 6926 |
| 7 | It's time to dust ourselves off and prepare fo... | 97 | 1285150203952209920 | 2020-07-20 09:51:00+00:00 | <a href="https://ads-api.twitter.com" rel="nof... | 7156 | 490 |
| 8 | "We are really sad about the result and losing... | 140 | 1285125803165048833 | 2020-07-20 08:14:02+00:00 | <a href="http://www.falcon.io" rel="nofollow">... | 13992 | 1067 |
| 9 | 💬 "We're very disappointed but we need to be b... | 102 | 1284958943689576448 | 2020-07-19 21:11:00+00:00 | <a href="https://ads-api.twitter.com" rel="nof... | 7510 | 604 |
After creating the full dataframe, I will continue to extract interesting information available as follows using Numpy package:
- The Tweet with more likes and its word length:
# extract the tweet with more FAVs and more RTs:

fav_max = np.max(data['Likes'])
rt_max  = np.max(data['RTs'])

fav = data[data.Likes == fav_max].index[0]
rt  = data[data.RTs == rt_max].index[0]

# Max FAVs:
print("The tweet with more likes is: \n{}".format(data['Tweets'][fav]))
print("Number of likes: {}".format(fav_max))
print("{} characters.\n".format(data['len'][fav]))
The tweet with more likes is:
A hero. An inspiration. One of our own.

We are so proud of you, @MarcusRashford ❤️ https://t.co/haAb0m2I4u
Number of likes: 197739
107 characters.
- The Tweet with more retweets and its word length:
# Max RTs:
print("The tweet with more retweets is: \n{}".format(data['Tweets'][rt]))
print("Number of retweets: {}".format(rt_max))
print("{} characters.\n".format(data['len'][rt]))
The tweet with more retweets is:
A hero. An inspiration. One of our own.

We are so proud of you, @MarcusRashford ❤️ https://t.co/haAb0m2I4u
Number of retweets: 33131
107 characters.
Having the Length of the Twitters, how many likes and retweets they can have, allowed me to retrieve the average Twitter’s length:
- Average Length of twitters in Manchester United Account:
#Visualization and basic statistics

#Averages and popularity

# extract the mean of lengths:
mean = np.mean(data['len'])

print("The lenght's average in tweets: {}".format(mean))
The length's average in tweets: 92.554
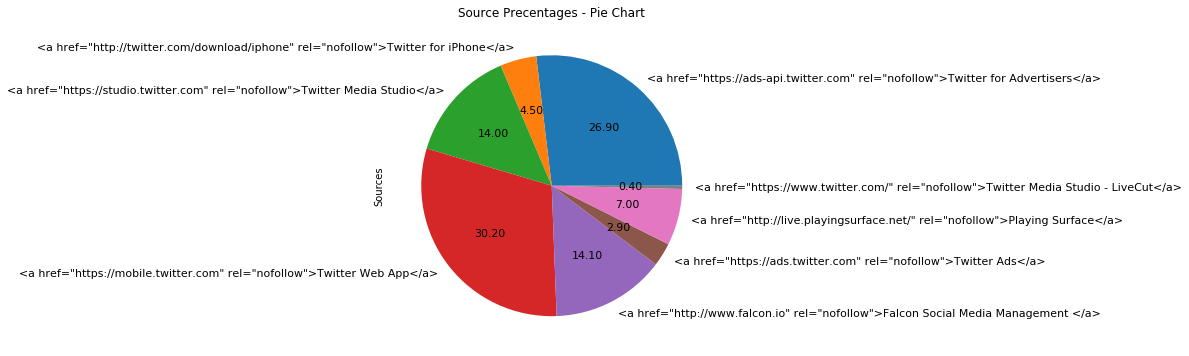
Other useful information is the user action source, which let us know how users are posting their tweets, as in the following pie Chart.
# obtain all possible sources:
sources = []
for source in data['Source']:
    if source not in sources:
        sources.append(source)

# print sources list:
print("Creation of content sources:")
for source in sources:
    print("* {}".format(source))
Creation of content sources:
* <a href="https://ads-api.twitter.com" rel="nofollow">Twitter for Advertisers</a>
* <a href="http://twitter.com/download/iphone" rel="nofollow">Twitter for iPhone</a>
* <a href="https://studio.twitter.com" rel="nofollow">Twitter Media Studio</a>
* <a href="https://mobile.twitter.com" rel="nofollow">Twitter Web App</a>
* <a href="http://www.falcon.io" rel="nofollow">Falcon Social Media Management </a>
* <a href="https://ads.twitter.com" rel="nofollow">Twitter Ads</a>
* <a href="http://live.playingsurface.net/" rel="nofollow">Playing Surface</a>
* <a href="https://www.twitter.com/" rel="nofollow">Twitter Media Studio - LiveCut</a>
#create a numpy vector mapped to labels:
percent = np.zeros(len(sources))

for source in data['Source']:
    for index in range(len(sources)):
        if source == sources[index]:
            percent[index] += 1
            pass


percent /= 100

# Pie chart:
pie_chart = pd.Series(percent, index=sources, name='Sources')
pie_chart.plot.pie(fontsize=11, autopct='%.2f', figsize=(6, 6));
plt.title('Source Precentages - Pie Chart')
plt.show()
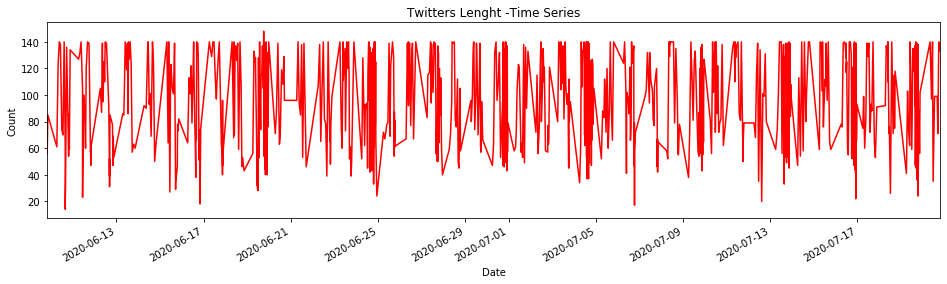
It is also important to check the twitter’s length through the time, which is visualized on the following graph.
# Time series

#  time series for data:

tlen = pd.Series(data=data['len'].values, index=data['Date'])
tfav = pd.Series(data=data['Likes'].values, index=data['Date'])
tret = pd.Series(data=data['RTs'].values, index=data['Date'])


# Lenghts along time:
tlen.plot(figsize=(16,4), color='r');
plt.ylabel('Count')
plt.title('Twitters Lenght -Time Series')
plt.show()
It is also interesting how the Tweets are Liked or Retweeted through the time, which can be visualized in the following graph.
# Likes vs retweets visualization:
tfav.plot(figsize=(16,4), label="Likes", legend=True)
tret.plot(figsize=(16,4), label="Retweets", legend=True);
plt.ylabel('Count')
plt.title('Retweets vs Likes - Time Series')
plt.show()
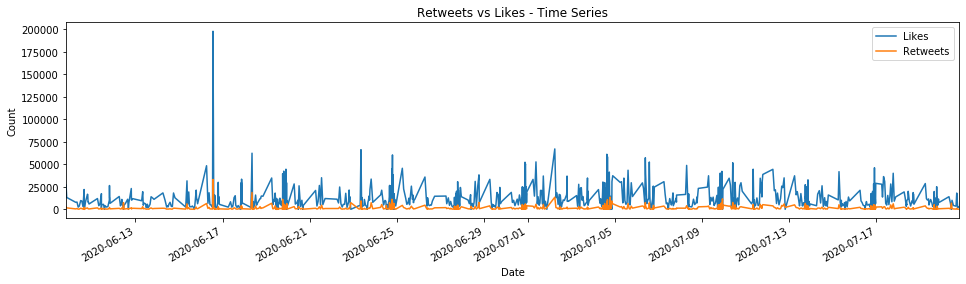
This source of plots is extremely helpful to understand the user’s behaviour, as we could note when the Manchester United account was more active and could match with particular facts happening in these days.
For example, the chart elucidates that there was an event that made the Manchester United followers be more active around the 17th of June of this year, in terms of Likes, which match with the re-start of the Premier League after the COVID-19 shutdown.
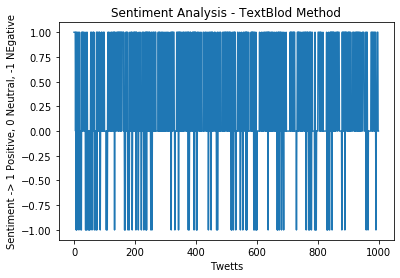
Sentiment Analysis
In order to identify what are the perceptions and feelings towards Manchester United, the use of unsupervised sentiment analysis on a set of Tweets was performed, using the Textblob approach.
This approach is basically the same as word counting but uses an algorithm that has an integrated dictionary of positive and negative words and only classifies the tweets as Positive 1, negative 0 or neutral 0, as follow:
# Sentiment analysis

#Importing textblob

from textblob import TextBlob
import re

def clean_tweet(tweet):
    '''
    Utility function to clean the text in a tweet by removing
    links and special characters using regex.
    '''
    return ' '.join(re.sub("(@[A-Za-z0-9]+)|([^0-9A-Za-z \t])|(\w+:\/\/\S+)", " ", tweet).split())

def analize_sentiment(tweet):
    '''
    Utility function to classify the polarity of a tweet
    using textblob.
    '''
    analysis = TextBlob(clean_tweet(tweet))
    if analysis.sentiment.polarity > 0:
        return 1
    elif analysis.sentiment.polarity == 0:
        return 0
    else:
        return -1

#create a column with the result of the analysis:
data['SA'] = np.array([ analize_sentiment(tweet) for tweet in data['Tweets'] ])
plt.plot(data['SA']) # plotting by columns
plt.ylabel('Sentiment -> 1 Positive, 0 Neutral, -1 NEgative')
plt.xlabel('Twetts')
plt.title('Sentiment Analysis - TextBlod Method')
plt.show()
Once we have the sentiment per tweet, I print the full data frame with the new SA field to see the results of this analysis in our full dataframe.
# display the updated dataframe with the new column:
display(data.head(10))
| Tweets | len | ID | Date | Source | Likes | RTs | SA | |
|---|---|---|---|---|---|---|---|---|
| 0 | "Watching him I thought, he's definitely got s... | 133 | 1285290880925085696 | 2020-07-20 19:10:00+00:00 | <a href="https://ads-api.twitter.com" rel="nof... | 2812 | 199 | 1 |
| 1 | 📖 Our #MUNWHU issue of #UnitedReview is now av... | 140 | 1285270496653848582 | 2020-07-20 17:49:00+00:00 | <a href="https://ads-api.twitter.com" rel="nof... | 1858 | 112 | 1 |
| 2 | We’re glad you’re okay, @EricBailly24 ❤️\n\n#M... | 71 | 1285255401542496259 | 2020-07-20 16:49:01+00:00 | <a href="http://twitter.com/download/iphone" r... | 18045 | 1108 | 1 |
| 3 | The latest fitness update for our penultimate ... | 99 | 1285244172941885440 | 2020-07-20 16:04:24+00:00 | <a href="https://ads-api.twitter.com" rel="nof... | 3437 | 241 | 1 |
| 4 | ⚽️ A classic #GoalOfTheDay, brought to you by ... | 99 | 1285200032476454914 | 2020-07-20 13:09:00+00:00 | <a href="https://studio.twitter.com" rel="nofo... | 4262 | 409 | 1 |
| 5 | All eyes on the run-in 👊\n\n#MUFC #PL | 35 | 1285176628335673344 | 2020-07-20 11:36:00+00:00 | <a href="https://ads-api.twitter.com" rel="nof... | 9992 | 672 | 0 |
| 6 | RT @MarcusRashford: There’s no where to hide t... | 140 | 1285166311308500993 | 2020-07-20 10:55:00+00:00 | <a href="https://mobile.twitter.com" rel="nofo... | 0 | 6926 | 1 |
| 7 | It's time to dust ourselves off and prepare fo... | 97 | 1285150203952209920 | 2020-07-20 09:51:00+00:00 | <a href="https://ads-api.twitter.com" rel="nof... | 7156 | 490 | -1 |
| 8 | "We are really sad about the result and losing... | 140 | 1285125803165048833 | 2020-07-20 08:14:02+00:00 | <a href="http://www.falcon.io" rel="nofollow">... | 13992 | 1067 | 1 |
| 9 | 💬 "We're very disappointed but we need to be b... | 102 | 1284958943689576448 | 2020-07-19 21:11:00+00:00 | <a href="https://ads-api.twitter.com" rel="nof... | 7510 | 604 | -1 |
And Finally I print the percentage of positives, negatives and neutral sentiment:
#Analyzing the results
# construct lists with classified tweets:

pos_tweets = [ tweet for index, tweet in enumerate(data['Tweets']) if data['SA'][index] > 0]
neu_tweets = [ tweet for index, tweet in enumerate(data['Tweets']) if data['SA'][index] == 0]
neg_tweets = [ tweet for index, tweet in enumerate(data['Tweets']) if data['SA'][index] < 0]


#print percentages:

print("Percentage of positive tweets: {}%".format(len(pos_tweets)*100/len(data['Tweets'])))
print("Percentage of neutral tweets: {}%".format(len(neu_tweets)*100/len(data['Tweets'])))
print("Percentage de negative tweets: {}%".format(len(neg_tweets)*100/len(data['Tweets'])))
Percentage of positive tweets: 36.9%
Percentage of neutral tweets: 55.0%
Percentage de negative tweets: 8.1%
After obtaining all the Statistics, plots, tables and Models applied over the 1000 tweets in the Official Manchester United Twitter account, we can conclude that Manchester United FC is a highly active account.
Twitter Manchester United’s fans are highly active, liking and retweeting the official Twitter account, the most liked tweet has 197739 and the most retweeted one has 33131.
Sentiment Analysis allows us to conclude that despite the team has lost the FA Cup Semifinal against Chelsea FC and is not yet qualified to the 2020/2021 Champions League, the fans are more inclined to provided positive opinions towards the team though the Twitter account.
Twitter API gives the chance to analyse the unstructured data and apply sentiment algorithms to understand people feelings or opinions towards a specific user or account.